- Home
- Platform 03 · Nature & Ecology
- Non-Native Plant Mycorrhizal Strategies Shift Across Biomes and Disturbance Levels
Non-Native Plant Mycorrhizal Strategies Shift Across Biomes and Disturbance Levels
A large-scale study drawing on over 2.2 million georeferenced vegetation plots from 14 biomes finds that the mycorrhizal strategies of non-native plants differ systematically depending on biome type and the degree of disturbance present.
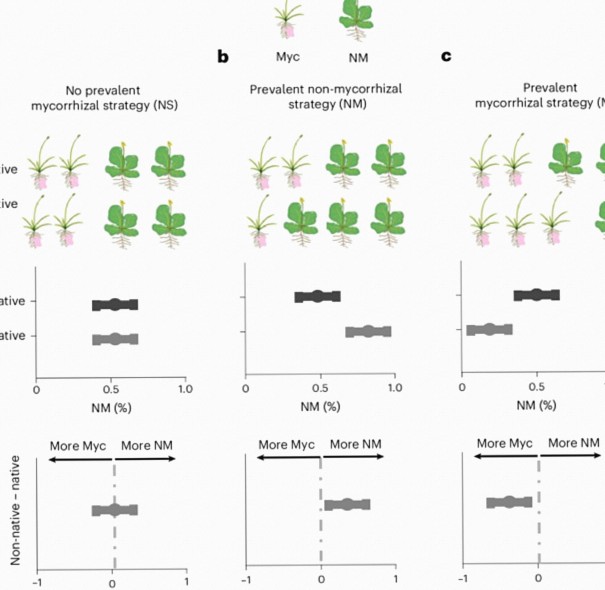
The study drew on the sPlot database (version 4.0), a global compilation of approximately 2.5 million georeferenced vegetation plot surveys carried out between 1888 and 2022 across all major biomes, with individual plot sizes ranging from 1 to 1,000 square metres. Each plant species recorded in those plots was classified as native or non-native using consensus assignments from two authoritative sources: the Global Naturalized Alien Flora (GloNAF) database, which covers the naturalisation status of more than 10,000 plant species across 1,029 geopolitical regions, and the Plants of the World Online (POWO) database, which holds native distribution data for over 1.4 million plant names.
Species occurrence records from sPlot were linked to GloNAF regions by matching species names with their geographic coordinates and extracting the corresponding region codes via Google Earth Engine, with the same procedure applied to POWO assignments. Plots where any species carried conflicting native-status assignments between the two databases were excluded to minimise classification uncertainty. Where plots had been resampled multiple times, only the most recent census was kept. After this filtering, the dataset retained 65,438 plant species across 2,231,767 vegetation plots, reduced from an initial 2,536,019 plot observations.
Mycorrhizal type and status
Mycorrhizal strategies were assigned using the FungalRoot database. The mycorrhizal types considered were arbuscular-mycorrhizal, ectomycorrhizal, dual arbuscular-mycorrhizal and ectomycorrhizal, and non-mycorrhizal, assigned first at the species level. Where species-level data were absent, assignment was made at the genus level, using the most frequently recorded mycorrhizal type across all empirical records available for species within that genus. Orchid mycorrhizal types were excluded because they represented only 0.02% of species in sPlot, and ericoid mycorrhizal types were absent entirely. Dual arbuscular-ectomycorrhizal plants accounted for just 0.004% of records and were also excluded.
Only plots in which at least 80% of species had been assigned a mycorrhizal status were retained, leaving 62,145 plant species and 1,867,058 vegetation plots. Mycorrhizal status was then categorised as mycorrhizal (arbuscular-mycorrhizal and ectomycorrhizal), non-mycorrhizal, or facultative-mycorrhizal, the last referring to plants capable of switching between ectomycorrhizal and non-mycorrhizal strategies. For each plot, species counts per mycorrhizal type and status were calculated separately for native and non-native plants. Retaining only plots where at least one non-native species occurred produced a final dataset of 440,788 vegetation plots containing 39,731 plant species from 14 biomes, sampled between 1899 and 2022.
Environmental variables and disturbance metrics
Plots were assigned to biomes following an established classification scheme. Climate data came from the CHELSA dataset, providing temperature and precipitation layers at approximately 1 square kilometre resolution, while soil properties were sourced from the SoilGrids database at 250-metre resolution. All spatial layers were harmonised to 30 arcseconds resolution. Predictors with collinearity values above 0.6 were removed; the retained set included mean annual temperature, mean annual precipitation, and four soil variables measured at 5 cm depth: coarse fragment volumetric fraction, sand particle proportion, organic carbon stock, and soil pH. Sensitivity analyses incorporating soil nitrogen and phosphorus were run in separate models owing to high spatial uncertainty in global nutrient rasters; results remained qualitatively consistent with the primary findings, with minor variation in xeric deserts attributed to smaller sample sizes of 387,593 plots.
Two disturbance metrics were used. The first, a Shannon Diversity Index (SDI) of disturbance, captured the intensity and frequency of both natural and human-caused disturbance events — including fires, floods, logging, and land conversion — over the 20-year period from 1999 to 2019. It was derived from land surface transitions detected across the full Landsat 5, 7, and 8 surface reflectance collection using the continuous change detection and classification product, computed at 30-metre pixel resolution within 250-metre grid cells. A high SDI value indicates areas with frequently occurring disturbances distributed evenly across space. Because the SDI covers only 1999 to 2019, its effect was tested against vegetation plots collected during that same period, totalling 249,947 plots. The second metric addressed specifically human pressure through landscape modification.
| Time | Service | Plat |
|---|---|---|
| 07:00 | Global butterfly ranges shifting dramatically in response to climate changeNature · 2026-08-05 | 03 |
| 07:00 | Satellite Data Underestimates Carbon Stored in Mature Forests WorldwideNature · 2026-07-31 | 03 |
| 07:00 | One in Ten Butterfly Species Has Shifted Range as Climate WarmsEurekAlert! Science News Releases · 2026-08-05 | 03 |
| 07:00 | Resource–Trait Coordination Under Multiple Global Change Factors Shapes Ecosystem StabilityNature · 2026-09-14 | 03 |
| 07:00 | Common Birds and Butterflies Forecast to Decline Across Europe Despite Conservation PoliciesNature · 2026-07-31 | 03 |